About Jake Olivier

Associate Professor in Statistics, University of New South Wales

More Cherry-Picking from Cycle-Helmets.Com

Last month I posted a commentary regarding incorrect information on cycle-helmets.com. I attributed a problem in their analyses of cycling surveys in South Australia to a “transcribing problem”. However, the issues seem to be much more serious than that.

In the comment section of an article I authored on The Conversation, Dorothy Robinson stated

Australians generally consider cycling a healthy activity, so the discrepancy between the two sets of tables in the South Australian report might reflects a reluctance to admit they cycled less because of helmet laws. The “really big” boo-boos Linda talks about were caused by her looking at the wrong tables. Table numbers are now included in http://www.cycle-helmets.com/helmet-law-spin.html so that others will not make the mistake of attributing the differences between these tables to “transcribing errors”.

The website now refers the reader to Tables 5a and 5b (Destination of bicycle trips in the last 7 days). This isn’t completely correct as total responders were taken from Tables 1a and 1b (Frequency of bicycle riding).

The total cycling in the past week do not match up between Tables 1a/1b and 5a/5b. This is likely due to (near) complete responses for amount of cycling but missing responses for destinations. This is common when conducting surveys and highlights the problem with combining such tables, especially when there is no need to do so. In other words, if you’re really interested in comparing cycling rates before and after helmet legislation, why would you not use the frequency of cycling tables?

There is also the issue of throwing away usable data. Tables 1a and 1b contain information for four categories of cycling frequency (“At least once a week”, “At least once a month”, “At least once every 3 months”, “Less often or Never”). This information is mostly thrown out by combining the total responses for destinations in Tables 5a and 5b with the total cyclists in Tables 1a and 1b. Here is a summary of the proportions of cycling in South Australia across age groups and gender for years 1990 and 1993.

Cycling in South Australia
1990 1993
At least weekly 21.8 21.0
At least monthly 5.2 6.0
At least every 3 months 3.9 4.4
Less often or never 69.1 68.6

These results suggest the SA helmet law had no impact on the amount of cycling. The suggestion by Robinson that responders are reluctant “to admit they cycled less because of helmet laws” is unsubstantiated. If someone is reticent to admit they don’t exercise, this would apply to both the 1990 and 1993 surveys.

I’d like to be wrong about this, but the analysis on this website reeks of fishing for results that support a pre-determined conclusion.

Did Australian helmet law “kill” UK cycling to work?

There’s a recently published article in The Conversation about common misinterpretations of research. I strongly disagree with their take on helmet legislation and I have even stronger concerns they cite the Bicycle Helmet Research Foundation as a reliable source for information. I have communicated my concerns to the article’s authors privately.

There were lots of comments about helmet legislation — both critical and supportive. Here is one from Dorothy Robinson that I found very strange.

Adding in Scotland (which used to be included in the census data but now appears to have gone its own way), UK census data on cycling to work are:
1981: 3.76%
1991: 2.97%
2001: 2.89%
2011: 2.96%

Note that no citation was given for this data and I don’t know where it exists on the web. Some UK census data for cycling to work exists here.

For many years now, Robinson and the BHRF have used census data and counts from helmet use surveys to argue helmet legislation in Australia have significantly deterred people from cycling. In the UK, cycling to work decreased 21% from before any helmet legislation (1981) to after most Australians were subjected to such laws (1991). Note that during those same years, the Australian census data reported 1.11% and 1.13% travelled to work by bicycle in capital cities.

This certainly does not mean helmet legislation in Australia had anything to do with cycling rates in the UK (this post’s title is meant to be tongue-in-cheek). Cycling in Denmark has decreased 17% since 1990 (year of the first helmet law in Victoria) and no one believes this had anything to do with Australian helmet laws. However, I think such thought experiments highlight the problems in drawing strong conclusions from such analyses.

Census data is taken over a day and successive observations are five years apart (in the UK they are apparently 10 years apart). Treating this data as a time series ignores the day to day variability in the proportions of travel modes. There are lots of factors that influence whether someone cycles (including regular cyclists). Two observations, five or ten years apart doesn’t remotely account for that.

Yearly estimates of cycling participation/amount and broad categories about cycling frequency would be an improvement. An honest assessment of the quality of the available data and its limitations is sorely needed in this area. It seems there are some that are quite content with data as long as it supports their conclusions.

Bad Science Doesn’t Allow Comments That Contradict Author?

Update: Ben Goldacre has now published Linda Ward’s commentary. See comments below for more details.

The blog Bad Science is written by Ben Goldacre where he discusses problems he sees with science. To this end, he has also authored two books Bad Science and Bad Pharma. I am usually supportive of those who try to make sense and “correct” misconceptions about science to the general public.

For his effort, Goldacre should be applauded. However, he published a head-scratching commentary in the BMJ about bicycle helmets with David Spiegelhalter. Goldacre posted a short discussion and link to the commentary on his blog. I found their take on the topic to be misinformed and uncritical of anti-helmet advocates. This is a topic someone like Goldacre should take head on, but instead seems content to regurgitate anti-helmet rhetoric.

Linda Ward tried posting a comment to Bad Science detailing much of the evidence ignored by Goldacre and Spiegelhalter back in April 2014. Her comment was not published and I don’t know why.

Here is her comment in full.

Several population level helmet law studies have controlled for background trends and included both head and non-head injuries, and shown that the effect of the legislation on hospital admissions for cycling head injuries to be far from minimal:

– Carr/MUARC (1995), http://www.monash.edu.au/miri/research/reports/muarc076.html (Victoria, Australia)
– Hendrie (1999), http://www.ors.wa.gov.au/Documents/Cyclists/ors-cyclists-report-helmets-evaluation.aspx (Western Australia)

– Povey (1999), http://www.ncbi.nlm.nih.gov/pubmed/10487351 (New Zealand)

– Scuffham (2000), http://www.ncbi.nlm.nih.gov/pubmed/10487351 (New Zealand)

– Karkhaneh (2006), https://era.library.ualberta.ca/public/view/item/uuid:432ec921-cf50-4b91-8ab9-50f29baf074b (Alberta, Canada)

– Walter (2011), http://www.ncbi.nlm.nih.gov/pubmed/21819836 (New South Wales, Australia)

The head injury results in all these population-level longitudinal studies, and the AIS3/4 head/brain injury results in the Carr study, are consistent with the (hospital control) results of the Thompson Cochrane Review, and the Attewell and Elvik meta-analyses, of case-control studies.

Two factors are likely to be responsible the Dennis minimal effect finding: collinearity (between ‘time’ and ‘time since intervention’); and such a tiny number of pre-law data points for Ontario (30% of the 1994 injuries, law was Oct 95) and British Columbia (19% of the 1994 injuries, law was Sep 96).

Dennis et al. cite the Scuffham and Walter studies as being “limited by sample size or methodological quality”. However both the Scuffham and Walter analyses took baseline trends into account, and had (more than) adequate sample sizes. Macpherson claimed that the Povey and Scuffham analyses, and a preliminary (1992) MUARC study by Cameron, “failed to include a concurrent control group in the analysis”; however all 3 analyses used cyclist non-head injuries as concurrent control groups. (Povey’s and Scuffham’s analyses also included non-cyclist injuries.) Dennis also cites the preliminary 1992 Cameron/MUARC study; both Macpherson and Dennis have apparently overlooked the (1995) Carr/MUARC study (4 years of post-law data), which superceded the (1992) Cameron study (1 year of post-law data).

This (2013) paper debunks the Fyhri and Walker risk compensation, and Robinson safety in numbers, claims: http://acrs.org.au/wp-content/uploads/26_Olivier_PR.pdf (also see https://injurystats.wordpress.com/author/jakeolivier/). With respect to the 85/88% in the “Seattle” study, Guy Chapman states that “nothing approaching this has ever been observed in a real cyclist population and the case and control groups were completely different”. By “real cyclist population” and “completely different” “case and control groups”, it seems that Guy may mean population-level longitudinal studies, and hospital vs population controls. I am not aware of any studies using population controls, it would be helpful if Guy were to cite the studies he is talking about (and a reference for his claim, on a Wikipedia talk page last year, that “50% of cyclist deaths in London are due to crushing by goods vehicles at junctions, cause of death being abdominal trauma”).

Guy states that “substituting co-author Rivara’s own street count data in the 1989 study, instead of their assumed value, makes the effect vanish into the statistical noise”, but does not provide an references. Struggling to understand how one could (validly) “substitute” “Rivara’s own street count data” into a case-control study (and finding no helmet studies in with Rivara as 1st author in PubMed), I forced myself to have a look at the (truly dreadful) cyclehelmets site. Guy’s claim that substituting “Rivara’s own” data . . . makes the effect vanish into the statistical noise” seems to be referring to the http://www.cyclehelmets.org/1068.html claim that “Of 4,501 child cyclists observed cycling around Seattle, just 3.2% wore helmets. This is not statistically different from the 2.1% of the hospital cases who were wearing helmets”. The required sample size, to detect a difference (with 80% power) between 2.1% and 3.2%, is 3,346 in EACH group; the cyclehelmets site states that there were 135 cases. The effect does not “vanish into the statistical noise”, it is (statistical) rubbish to claim, on the basis of such grossly inadequate sample size (less than 1/20th of the numbers cases required for such a comparison), that the lack of a statistically significant effect is (real) evidence that there is no effect.

I am still wondering what Guy means by “assumed value”, it would be helpful if Guy could explain how the the case-control study “assumed” helmet wearing prevalence.

It is the BHRF site (cyclehelmets) site, not the Cochrane review, that is disgraceful: the site also misrepresents the results of the Carr, Hendrie, Povey, Scuffham, Karkhaneh, Walter, Attewell, and Elvik studies; it also misrepresents the results of the Australian (Victorian, New South Wales, and South Australian) participation surveys (see the above Olivier/ACRS link).

My current ‘favourite’ example is the claim (http://www.cyclehelmets.org/1146.html) that “Helmeted cyclists have about the same percentage of head injuries (27.4%) as unhelmeted car occupants and pedestrians (28.5%). Wearing a helmet seems to have no discernible impact on the risk of head injury.”. The reference cited is “Serious injury due to land transport accidents, Australia, 2003-04”. As a BHRF “editorial board” member, maybe Guy can explain how it is possible to draw such a conclusion from a report that does contain any information as to what the head injury rates were prior to the helmet legislation?

(The BHRF: a perfect teaching case for how NOT to ‘do’ epidemiology?)

As a demonstration Linda actually submitted her comments, here are screenshots.

BadScience1 BadScience2 BadScience3

Transcribing Problems with cycle-helmets.com Analysis

I recently discussed problems replicating the results found in an assessment of mandatory helmet legislation in Australia published in Accident Analysis and Prevention (Robinson, 1996). This issue was introduced to me by Linda Ward who has pointed to a related issue.

The anti-helmet website http://www.cycle-helmets.com has a page titled “Spinning” helmet law statistics. Under the heading Measuring changes in cycle use, the webpage states

Similarly, in South Australia a telephone survey found no significant decline in the amount people said they cycled but there was a large, significant drop in how much they had actually cycled in the past week 24. In 1990 (pre-law), 17.5% of males aged at least 15 years reported cycling in the past week (210 out of 1201), compared to 13.2% (165 out of 1236) post-law in 1993. For females, 8.1% (102 out of 1357) had cycled in the past week in 1990 compared to 5.9% (98 out 1768) in 1993 24.

These reductions (24% for males, 26% for females aged at least 15 years) are statistically significant (P < 0.005 for males, P = 0.025 for females).

The citation given is a technical report that evaluated the introduction of helmet legislation in South Australia.[1] Table 1 of the SA report gives frequencies of bicycle riding from two surveys, one in 1990 and the other in 1993, for those aged 15 years or older separated by gender. In this survey, the amount of cycling split into four categories: “At Least Once A Week”, “At Least Once A Month”, “At Least Once Every 3 Months” and “Less Often or Never”. The SA helmet law went into effect on 1 July 1991.

The main problem here is the numbers in the above quote don’t match up to the data in the original report. Here is a screenshot of the table.

Marshall_Tab1

When these numbers are corrected and a comparison is made for those cycling at least once a week versus everyone else, the p-values are 0.279 and 0.450 for males and females respectively. Additionally, the relative risks are 0.90 (95% CI: 0.76,1.08) and 0.91 (95% CI: 0.71, 1.17) for males and females respectively. The point estimates for changes in the proportion cycling in the past week are much less than those reported on the webpage.

In addition to using the wrong data, I don’t agree with the analysis. There are four cycling categories which have been collapsed into two — those who cycle at least once a week and those who don’t. A lot of information is needlessly removed from the data. Instead, a chi-square test for independence could’ve been performed and individual changes could be assessed through an investigation of the residuals.

The Pearson residuals for an individual cell from a chi-square test are

r=\dfrac{O-E}{\sqrt{E}}

where O are the observed frequencies and E is the expected frequency under an assumption of independence, i.e., no relationship between helmet legislation and the amount of cycling. These residuals are asymptotically normal, so residuals with absolute value greater 1.96 may be considered “statistically significant”. The sign would indicate observing more than expected (if positive) or less than expected (if negative).

When analyses are performed on the full tables, the chi-square tests give p-values of 0.20 and 0.85 for males and females respectively. None of the residuals have absolute value anywhere near 1.96. The largest residual pair is for males cycling “at least once every 3 months”. The signs of the residuals indicate there is less cycling than expected in 1990 (r=-1.04) and more cycling than expected in 1993 (r=1.02) if there is no relationship between helmet legislation and amount of cycling. Here is some R code to do those analyses.

males=matrix(c(204,190,66,83,58,77,871,886),nrow=2)
males

females=matrix(c(104,123,59,74,52,64,1141,1507),nrow=2)
females

chisq.test(males,correct=F)
chisq.test(females,correct=F)

chisq.test(males,correct=F)$residuals
chisq.test(females,correct=F)$residuals

The analyses above are stratified by gender and we could perform a unified analysis using Poisson regression. This model is essentially

log(\mu)=\beta_0+\beta_1YEAR+\beta_2FREQ+\beta_3GENDER+\beta_4YEAR*FREQ+\beta_5YEAR*GENDER+\beta_6FREQ*GENDER+\beta_7YEAR*FREQ*GENDER

I’ve simplified things a bit here because the variable FREQ has four categories and therefore gets estimated by three dummy variables.

The important comparison here is the interaction between YEAR and FREQ. If significant, this would indicate helmet legislation and amount of cycling are associated. Using the given South Australian data, the three-way interaction was non-signficant, so was removed from the model. The p-value of the interaction between YEAR and FREQ is not statistically significant (p=0.41).

No analysis I’ve performed indicates a significant relationship between helmet legislation and amount of cycling in South Australia among those 15 years or older when using the correct data.

Note: The anti-helmet website http://www.cycle-helmets.com is maintained by Chris Gillham. I previously discussed problems with this website here. If you download the PDF version of this report, the author is listed as “Dorre” who I believe is Dorothy Robinson. Both Gillham and Robinson are editorial board members of the anti-helmet organisation Bicycle Helmet Research Foundation.

  1. Marshall, J. and M. White, Evaluation of the compulsory helmet wearing legislation for bicyclists in South Australia Report 8/94, 1994, South Australian Department of Transport, Walkerville, South Australia.

Something Amiss in Robinson (1996)

A 1996 article titled “Head Injuries and Bicycle Helmet Laws” published in Accident Analysis and Prevention is one of the most highly cited papers assessing the effect of helmet legislation.[1] (148 citations, Google Scholar, 4 Sept 2014) Additionally, this seems to be the first article purportedly demonstrating a negative impact of such laws. The conclusions of this paper state

Consequently, a helmet law, whose most notable effect was to reduce cycling, may have generated a net loss of health benefits to the nation.

In this paper, secondary analyses were performed on data contained in other reports. I’ve pointed out in a previous paper[2] that NSW adult cycling counts exist from sources cited in this paper although they are not presented. This is curious because the counts of adult cyclists from NSW helmet use surveys increased from pre- to post-helmet legislation which contradicts the conclusions of this paper. Adult cycling also increased by 44% in Victoria following helmet legislation.[3]

Linda Ward has pointed to another issue with this paper regarding a comparison of the proportion of head injury hospitalizations to cyclists before and after legislation in Victoria. Some of the relevant data is given in Table 6.[1] In this table, the proportion of head injuries are 31.4% for 1989/90 and 27.3% for 1990/91 for hospital admissions in Victoria. During this period, there are a total of n=2300 cycling hospitalizations. The author notes a comparison of these proportions is non-significant by a chi-square test.

The 2×2 table for this data can be reproduced using the source material.[4] Figure 25 of this report gives “All Other Injuries” of about 900 for year 1989/90. This allows us to fill in the rest of the table given below.

Year Other Injury Head Injury
1989/90 900 412
1990/91 718 270

The frequencies of the other cells seem to correspond to the other values in Figure 25. The chi-square test for this table results in \chi^2=4.49, p=0.03 and OR=0.82. This result could be influenced by the need to estimate the number of cases from a plot. We can assess the influence of this estimate by repeating the analysis for other values near 900. Choosing values from 890 to 910 results in the plot of p-values below.

Robinson_pvalue

As you can see, there is a statistically significant decline in head injury in each instance for cycling injury in Victoria before and after helmet legislation. R code to reproduce these results is given below.

n=2300
p1=0.314
p2=0.273

a=900
n1=round(900/(1-p1))
b=n1-900
n2=n-n1
d=round(n2*p2)
c=n2-d

tab=matrix(c(a,b,c,d),nrow=2,byrow=T)
rownames(tab)=c(‘1989/90′,’1990/91’)
colnames(tab)=c(‘Other’,’Head Injury’)
tab

chisq.test(tab,correct=F)
fisher.test(tab)

This re-analysis has important ramifications. First, the author’s conclusions are not fully justified. Cycling head injuries fell at a rate greater than other cycling injuries following legislation. It is possible there was less cycling following legislation, but head injuries fell at a significantly greater rate. We also found this to be true in NSW in a 2011 paper. Secondly, organizations that have used this paper to justify their opposition to helmet legislation should reconsider their stance. This includes the Transport and Health Study Group (THSG) which is affiliated with the Journal of Transport and Health (JTH). Finally, the editors of Accident Analysis and Prevention and the journal’s publisher Elsevier should seriously investigate the reproducibility of the analyses in this paper with a keen eye for the information found in the source material that was not included in the paper.

Note: Dorothy Robinson is a patron and editorial board member of the anti-helmet organization Bicycle Helmet Research Foundation.

  1. Robinson, DL (1996) Head injuries and bicycle helmet laws. Accident Analysis and Prevention, 28, 463-475.
  2. Olivier J, Grzebieta R, Wang JJJ & Walter, S. (2013) Statistical Errors in Anti-Helmet Arguments. Proceedings of the Australasian College of Road Safety Conference. http://acrs.org.au/wp-content/uploads/26_Olivier_PR.pdf
  3. Cameron, M., Vulcan, AP, Finch, CF & Newstead, SV. (1994) Mandatory bicycle helmet use following a decade of helmet promotion in Victoria, Australia — An evaluation. Accident Analysis and Prevention, 26, 325-337.
  4. Cameron, M, Heiman, L & Neiger, D. (1992) Evaluation of the bicycle helmet wearing law in Victoria during its first 12 months. Report No. 32, Monash University Accident Research Centre.

Plotting Data That Doesn’t Exist is a Bad Idea

I came across a blog post recently that gives someone’s take on bicycle helmet legislation in New Zealand (links here and here). The post includes the plot below created by Chris Gillham on his anti-helmet advocacy website http://www.cycle-helmets.com (the NZ analysis is here). Gillham is also an editorial board member of Bicycle Helmet Research Foundation.

newzealandhelmetsv6

The figure shows the number of cyclists in New Zealand declined around the helmet law in 1994 and was roughly flat thereafter. Gillham’s estimate of injuries per 100,000 cyclists has increased during that time.

This figure (and others) is discussed on the Wikipedia page for Bicycle Helmets in New Zealand. It states

Australian journalist Chris Gillham [19] compiled an analysis of data from Otago University and the Ministry of Transport, showing a marked decline in cycling participation immediately following the helmet law introduction in 1994. At the same time as the number of cyclists aged over 5 years approximately halved, the injury rate approximately doubled. Noting both the decline in numbers and increase in injury rate preceded the law’s introduction at the start of 1994, possibly attributable to the fact that heavy promotion of helmets had been ongoing in the lead-up to the law’s introduction. This phenomenon of just helmet promotion leading to a reduction in cycling has been witnessed in several countries.[20] See Figure 2.

The problem here is that much of the cycling participation data shown simply does not exist.

The link takes you to Reports and Fact Sheets from the NZ Household Travel Survey. In the Cycling Fact Sheet, Tables 5-7 includes historical data from past surveys taken during the years 1989/90, 1997/98 and 2003-2012. So, there is no data prior to 1989, between 1991-1996, and between 1999-2002. Importantly, there is no cycling participation data in a 6-year window around the NZ helmet law date of 1 January 1994. Here’s a plot that accurately represents the NZ cycling participation survey data.

NZ_Participation

Although there are only two surveys prior to 2003, Gillham’s plot contains data for each year. Where did this new data come from? Gillham states

This pop-up table is based on the Ministry of Transport surveys of 5yo+ cycling participation as a percentage of population, as displayed above, with trends smoothed to compensate for the irregularity of the survey timeline.

I find this result quite curious. There are only two surveys, and therefore only two points, before 2003. Fitting a linear model requires the estimation of an intercept, a slope and additional parameters for any changes in the initial linear pattern. Starting with 1988, I count two changes in the trend up to 1997 (could be three, but the 1991 data is hard to see). Therefore, four parameters would need to be estimated to reproduce this “smooth” plot.

To estimate the parameters in a linear model, the number of data points must be at least the number of parameters. Since there are only two data points, only two parameters can be estimated, i.e., a slope and an intercept. Therefore, the “trend” given in Gillham’s plot is impossible given the data available. Note the red line graph relies on cycling participation data, so it is also incorrect.

There is also a problem with computing injuries per cyclist based on these surveys. The Household Travel Surveys capture cycling for transport, so it would not represent any changes in off-road cycling like mountain biking. It might be reasonable to compute injuries per cyclist involved in a motor vehicle collision, but injuries from non-motor vehicle collisions would be tenuous at best.

This issues are especially troubling because Gillham’s analysis forms part of the research knowledge base on Wikipedia where, I believe, most laypeople and media types get their information. Note that many of the contributors to the Wikipedia page are editorial board members of the anti-helmet organisation Bicycle Helmet Research Foundation. There have been discussions to limit their negative and undo influence, but nothing has come of it.

So, why was there a drop in cycling between the first and second surveys?

It’s really hard to tell given there are only two time points and there is no way to assess changes relative to helmet legislation with only one pre-helmet law time point. It could very well be the decline in cycling participation started long before the helmet law. One NZ research article notes cycling participation in NZ declined steadily from 1986 onwards.

The website for the 1997/98 Travel Survey actually discusses the changes in on-road cycling since the 1989/90 survey.

Between 1989/90 and 1997/98, on-road cycling has decreased by 19 percent, with the largest decrease among school-age children and teenagers. Other countries have also seen large reductions in cycling (for example, cycling in Great Britain has fallen by 20 percent over the same period*). Once an almost universal mode of transport for school children, concern about safety has seen cycling to school become less popular. However, there has been an increase in cycling, particularly longer trips, among the 20-24 age group.

* Source: “Road Accidents Great Britain 1998 The Casualty Report” (September 1999), Department of the Environment, Transport and the Regions, United Kingdom.

Since Great Britain does not have any form of helmet legislation and cycling participation declined at a rate similar to NZ, the evidence does not support the hypothesis the NZ helmet law deterred cycling rates.

Why I Started This Blog

I started this blog late last year, in part, as a response to the plethora of misinformation about bicycle helmets that exists on the internet. I believe much of the problem is a statistical one in that many people either don’t understand or they misuse statistical methods and/or data.

As an academic, the dilemma I found myself in was how to address criticism that originates outside the peer-review environment? When criticism is published in a peer-reviewed journal, it is usually possible to respond in a Letter to the Editor (or similar format). For what it’s worth, the strangely named Bicycle Helmet Research Foundation has an editorial board but no clear avenue for responding to their criticisms — there’s not even a comments section to their posts.

What follows is an email I wrote to Paul Jakma, the author of a blog post that was critical of one of my papers (he mentions he made a similar response here). As I pointed out to him, much of what he wrote was factually incorrect and he misunderstood either our analysis or the data used. To date, he has not corrected his post and, in that time, has left a comment pointing to Chris Rissel’s rejoinder to our paper while ignoring our response. He also seems to have ignored (or is unaware of) our paper showing the benefit of helmet legislation was maintained over the following two decades and there was no “apparent detrimental impact on safety in terms of head injury states” as he states in his post.

I could be wrong, but he doesn’t seem interested in getting his facts correct about our research. I have published my response so that ultimately the reader can make up their mind about the truth.

Email to Paul Jakma (19 January 2012)

I am confused by some of the comments on your blog and on the referring websites.

  1. “Injury rates are seasonal, and they have only very limited data (less than a year) on pre-law rates”

You first point is clearly true which makes monthly injury counts more variable than yearly counts. However, we accounted for that using the X11 method which adjusts for seasonal and abnormal patterns as stated in the paper. Your second point is not true – we used head and limb injury counts 18 months before the law and 18 months afterwards. This gives us plenty of time points (n=36 months) to estimate any trend effects. Inspection of the deviance residuals (not published) indicated we accounted for any seasonal or abnormal variability.

  1. “there appears to be a significant benefit only over a short-period of time”

This point seems to have floated around the blogsphere and is a complete myth. We explicitly state the following in the paper on page 2069.

The tendency towards stability in post-law trends with the inclusion of additional years of data suggests that either 18 months is not sufficient follow up time to accurately detect trends or that the trends shown represent temporally localised changes that did not persist beyond the analysis period. Based on the original analysis there is some evidence that the initial improvement in head injury rates diminished over the 18 months following legislation as shown by the increasing post-law head to limb injury ratios in Fig. 4. Alternatively, the longer term post-law trends being closer to parallel for head and limb injury rates (equivalent to a post-law horizontal line in Fig. 4A and C) supports the idea that the legislation attributable improvement was maintained.

This paragraph seems to be routinely ignored by those who’ve commented about the paper. We chose 18 months post-law to balance out the useable information available pre-law. This is the right approach statistically so that the information before or after the law isn’t dominating the analysis. However, the use of more post-law data demonstrated the benefit was maintained.

  1. “the helmet law has managed to turn a decreasing head injury rate into an increasing head injury rate”

This ties in with my previous point that long term trends (>18 months post law) were flat after the law. Also, note that there were 1288 head injuries in the pre-law period and dropped to 866 in the post-law period, while arm injuries took only a slight dip from 1158 to 1062.

  1. Equal exposure assumption

Your statement is pretty much verbatim from our paper. What we didn’t discuss, and probably should have in retrospect, is that the assumption seemed to work pretty well for arm injures and less so for limb injuries. Their general proximity to the head is likely the reason, i.e., injuries to body parts near each are more correlated than those farther away. Further, the monthly change in the head/arm ratio before the law is 0.997 (95% CI: 0.978-1.016) and 1.006 (95% CI: 0.96-1.06) afterwards. These estimates are virtually textbook examples of no effect/difference (ratio estimate near 1 with tight confidence intervals). Also, for the record, this ratio drops drastically after the law (0.725, 95% CI: 0.539-0.974).

  1. Comments about risk compensation

Many of your arguments seem to be based on #2 and #3, but there are additional reasons I don’t agree with this argument. The primary reason for comparing head to limbs over time is that changes in cycling environment or cycling rates would affect both. I’d recommend reading Povey et al. (1999) as they do a better job explaining this. The idea is that if risk compensation is happening due to more helmet wearing, all injuries would increase (as you point out) but head injuries dropped by almost a third and arm injuries were flat. It has also been suggested the drop is due to less people cycling, but that would mean limb injuries would drop as well and instead dipped slightly. Further, any combination of risk compensation or cycling rate fluctuations would be accounted for by limb injuries (also true for distances cycled). It is true we did not explicitly account for cyclist behaviour or types of cycling, but a person cannot separate their head from their limbs when they get on a bike. So, if a person changes their cycling behaviour after the law, it will affect both.

  1. Comments about fatalities not being included

As I mentioned in my previous email, hospitalisation data can include some fatalities but will not include all. Simply put, Australian data isn’t collected that way. I’ve got a few points about that. First, we used hospitalisation data uniformly before and after the law. If, in fact, helmets turn fatalities into survivable injuries as suggested, you would find an increase in head injuries post-law (which would make it more difficult to find a helmet law benefit). As mentioned above, long term trends for head injuries were flat post-law. That doesn’t mean the point is untrue because fatalities are rare, like I mentioned, and would thus have little influence on the trends in serious bicycle injuries (hospitalisations and fatalities). In a different paper, we found only 39 bicycle-related deaths from all causes in a five year period (2000/01 – 2004/05) (S. Chong et al. / Accident Analysis and Prevention 42 (2010) 290–296). Any cycling-related death is unacceptable, in my opinion, but the inclusion or exclusion of fatalities has little influence on our analysis.

Hospitalised head and limb injuries are quite serious. Most bicycle injuries probably go unreported and most that are reported do not lead to a hospitalisation (most that seem serious on the surface probably only go the ED and don’t get captured as a hospitalisation). These injuries are the ones that can have life-long detrimental effects. In my opinion, a drop in a third of those injuries after a policy change is a clear benefit.

You may have strong views about helmets or helmet laws, but we feel that we have been transparent in our analysis and have given reasonable justification for all aspects of our methods including their limitations. Throughout the process we aimed to be objective and I believe we’ve succeeded on that account.

Regards,

Jake

Effect Sizes, Overtaking Distance for Cyclists and Mandatory Helmet Legislation

I came across an interesting comment in an article by Alan Davies on The Urbanist. Davies discusses Ian Walker’s overtaking distance study which found a statistically significant association with helmet wearing and motor vehicle overtaking distance. Like a study I published last year, Davies did not find the results convincing with regards to helmets but found other factors like vehicle size and the cyclist’s position in the lane more important.

As expected, there were several comments defending Walker’s conclusions among those with anti-helmet views. A comment left by RidesToWork (who I believe is Bicycle Helmet Research Foundation editorial board member Dorothy Robinson) states

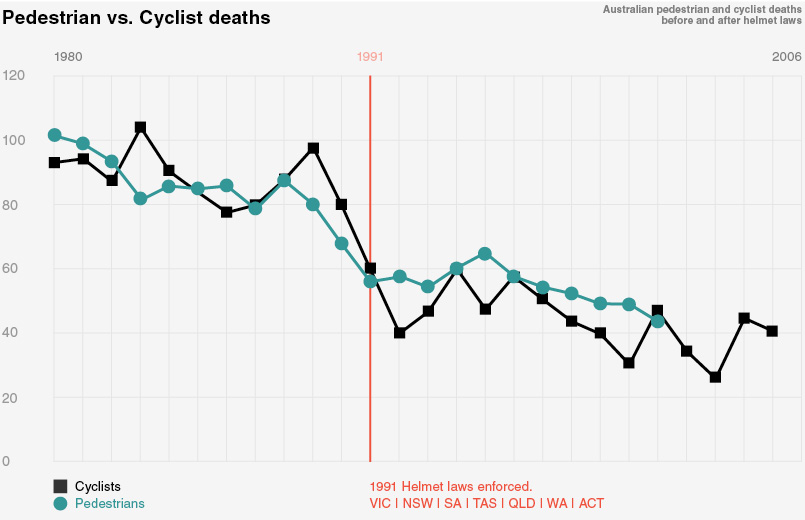
Many readers of this blog appear keen to dismiss the arguments than the difference in passing room might make a difference. Yet they don’t apply the same critical thinking to claims about helmet laws – such as Figure 2 of http://www.cyclehelmets.org/1228.html The effect, if there is one, is nothing like as clear as the effect of helmet wearing on passing distance.

I found this comment dubious, in part, because it links to an unfounded and misleading criticism of one my articles, but also because it’s quite a bold statement comparing the results from two very different studies. Walker’s analysis was a 2×5 ANOVA for motor vehicle overtaking distance while cycling in the UK with 2 levels of helmet wearing and 5 levels of distance to the kerb. Our study, used Poisson regression to model the rate of head and limb injury hospitalizations in NSW in the the three year period surrounding the helmet laws in 1991.

Note the Figure 2 mentioned in the comment has been dubiously manipulated through rescaling and shifting two time series so they overlap to produce a seemingly null effect. This seems to be a common tactic by anti-helmet advocates as I’ve discussed before here and here.

Regarding Robinson’s claim, the question is how can someone claim the results from one study are more “clear” compared to another, disparate study?

One method is to compare their effect sizes (ES) on some common scale. It is well known that large sample sizes can make unimportant differences statistically significant (the opposite is true for small sample sizes, i.e., important differences are not statistically significant). Take the one sample z-test for the population mean \mu, for example. The right tailed p-value converges to 0 as n tends to infinity for fixed values of \bar{x} and \sigma, i.e.,

\lim\limits_{n\rightarrow\infty}\mathcal{P}\left(Z>\sqrt{n}\dfrac{\bar{x}-\mu_0}{\sigma}\right)=0

As a result, a significant p-value is possible even when \bar{x} is infinitesimally close to \mu_0. For that reason, it is important not to overpower a study by choosing an excessively large sample size (Walker did just that in his study computing sample size based on 98% power instead of the usual 80% or 90%). Effect sizes are essentially the observed test statistic without the influence of sample size (conversely, it can be used to compute sample size a priori).

Jacob Cohen defined the difference in sample means divided by the sample standard deviation as an effect size for the two sample t-test, i.e.,

d=\dfrac{\bar{x}_1-\bar{x}_2}{s}.

Cohen further proposed operationally defined values of d\in\{0.2,0.5,0.8\} as smallmedium and large effect sizes respectfully[1]. The reasoning given by Cohen regarding these values is

My intent was that medium ES represent an effect likely to be visible to the naked eye of a careful observer… I set small ES to be noticeably smaller than medium but not so small as to be trivial, and I set large ES to be the same distance above medium as small was below it.

The results from both Walker’s data and our study on mandatory helmet legislation can be converted to Cohen’s d. An F statistic with 1 numerator degree freedom can be converted to Cohen’s d by

d=2\sqrt{\dfrac{F}{df_d}}

For helmet wearing, Walker reported F_{1,2313}=8.71 which correponds to d=0.12. This categorizes helmet wearing as a trivial, and therefore unimportant, effect size by Cohen’s definition.

It is also possible to convert to Cohen’s d for a linear model with a binary predictor x (takes on values 0 or 1) and corresponding coefficient \beta as

d=\dfrac{|\beta|}{se(\beta)}\sqrt{\dfrac{1}{n_1}+\dfrac{1}{n_2}}

where n_1 and n_2 are group sample sizes. In our re-analysis of Walker’s data, the adjusted effect of helmet wearing for Walker’s data is -0.058 respectively. There were 1206 and 1149 overtaking events when not wearing or wearing a helmet respectively which translates to d=0.16 (a more respectable value, although I doubt Walker or Robinson would ever agree with our results). Note that in my analysis, I did not use a square root transformation or remove 35 observations as Walker did as these considerations are unnecessary given the large sample size.

In our re-analysis of Walker’s paper, we also performed logistic regression to assess whether close overtaking was associated with helmet wearing as this is more relevant to cycling safety. Using the one meter rule as a cut point, we estimated a non-significant adjusted odds ratio of 1.13 (p=0.54). Odds ratios can also be transformed to Cohen’s d by

d=\dfrac{\sqrt{3}log(OR)}{\pi}

Using the adjusted odds ratio, we get d=0.07 which is again trivial by Cohen’s definition.

In our paper regarding mandatory helmet legislation, we reported a decline in bicycle related head injury relative to limb injury at the time of the NSW helmet law of 27.5% or 31% depending on whether arm or leg injuries were used as the comparator. These results can also be written as rate ratios of 0.725 or 0.69 respectively. If we assume the rate ratio here is equivalent to an odds ratio, Cohen’s d is 0.18 and 0.20 respectively.

Our analysis made the implicit assumption that no cyclist wore helmets pre-law and all cyclists wore helmets post-law. If, instead, the comparison was relative to the approximate 55% increase in helmet wearing in NSW, we get rate ratios of 0.56 and 0.51 and transformed Cohen d’s of 0.32 and 0.37.

I also published a paper last year that proposed operationally defined effect sizes for odds ratios that did not require transformation to Cohen’s d or make distributional assumptions regarding effect sizes. These were 1.22, 1.86 and 3.00 for small, medium and large odds ratios (or, equivalently, 0.82, 0.54 and 0.33).

These results suggest the helmet wearing effect from Walker’s data is trivial and the effect of helmet legislation is about a medium effect size. Of course, these results are from one cyclist and from one Australian state. So, over-generalizations should not be made without more data. However, note that Walker did repeat aspects of his first study comparing seven types of cyclists. The CASUAL type was the only one without a helmet with a mean overtaking distance of 117.61cm. This was approximately dead center of the means (range: 114.01cm – 122.12cm) suggesting the trivial helmet effect size from the original study was no coincidence.

  1. Cohen J (1992) A power primerPsychological Bulletin 112: 155–159.

More Misinformation from Freestylecyclists.org

I recently came across another excellent cycling article from Alan Davies at The Urbanist. In the article, Davies discusses claims that cycling accidents are on the rise. This is due to an increase in the cycling road toll in 2013. This may be a concern, but it’s impossible to establish a trend from one data point.

Davies briefly mentions helmet legislation, but notes it isn’t relevant to the current discussion (and I agree). However, in the comments, I found a few troubling responses regarding that topic. Strewth states

But we also know from analysis done in the 1990s that among cyclists, the decline in non-head injuries over this period was as great or greater than the decline in head injuries.

No citation or link is given to support this claim. This comment is strange since a previous study of mine estimates a 35% drop in cycling head injury hospitalizations with the NSW helmet law while arm and leg injuries dropped by only 11% and 6% respectively. A more comprehensive response was left by Linda Ward.

Another comment by Nik Dow states

A fact-based explanation is linked (see “detailed explanation”) http://www.freestylecyclists.org/do-helmet-laws-make-much-difference/ and covers the introduction of demerit points and ramping up of speed and red-light cameras.

The link takes you to Freestylecyclists.org, an anti-helmet organization I’ve discussed previously. My previous post pointed to misinformation presented by national spokesperson Alan Todd and the given link is more of the same.

The following plot of cycling and pedestrian fatalities from 1980-2006 in Australia is given and the anonymous author concludes declines in cycling deaths were mostly “due to massive ramping up of speed and red-light cameras, together with the introduction of demerit points.” I’ve assumed this is due to the pedestrian and cycling time series being placed on top of each other.

FSC-Chart-Post-Re-BuildsFA_Pedestrians

What is problematic here is this is not an accurate representation of the fatality data (much of it can be found here). The author has apparently rescaled the pedestrian time series to get them to overlay. As I’ve discussed before, this a strategy too often used to mislead actual temporal relationships of data. In the comments, Davies also questions the accuracy of this figure.

Plotting both time series on the same graph is problematic here since pedestrian fatalities have historically dwarfed those for cyclists (in 1989 they were 501 and 98 respectively). One method to address this problem is to index the time series to a starting value. An advantage of this approach is you’re able to plot trends without distorting scales; however, a disadvantage is the actual data is not being presented and each data point is a comparison with some starting value.

Below is such a plot for the period 1971 to 2013 for cycling and pedestrian fatalities in Australia (the vertical red lines represent the first and last helmet law dates in Australia).

Aust_Cyc_Ped_Fatal

This looks virtually nothing like the Freestylecyclist.org plot. Relative to 1971, pedestrian fatalities have steadily declined over the next 40 years, while cycling fatalities were flat up to the 1990, followed by a substantial decline by 1992 and flat thereafter. This does not suggest declines in cycling fatalities are associated with general road safety improvements such as demerit points or speed cameras. Further, the lack of temporal agreement between cycling and pedestrian fatalities prior to 1990 raises questions regarding pedestrians as a suitable comparator to cyclists.

It is not appropriate to make decisions about trends from eye-balling a figure, so I fit an interrupted time series model to this data. The Poisson model I used was

log(\mu)=\beta_0+\beta_1TIME+\beta_2LAW+\beta_3TIME*LAW

where TIME is centered at 1991 and LAW is an indicator that takes on the value 1 for years 1991 onwards and 0 everywhere else. My results suggest no pre-1990 trend for cycling fatalities (p=0.84) and a 42% decline in cycling fatalities at 1991 (p<0.001). Residual plots indicate good overall fit, although the 2013 observation may exhibit high leverage.0000

Aust_Fatal_Fit_Plots

Something profound happened for cycling fatalities in Australia between 1990-1992. It is often argued helmet legislation deters cycling; however, this is an argument I largely reject due to conflicting evidence from data of low quality.[1] Still, this does not necessarily indicate helmet legislation is a causal factor in lowering cycling fatalities. Yet, this analysis does rule out general road safety interventions as a causal influence proposed by Freedomcyclists.org.

  1. Olivier, J., Grzebieta, R., Wang, J.J.J. & Walter, S. (2013). Statistical Errors in Anti-Helmet Arguments. Australasian College of Road Safety Conference.

Why does anecdote trump evidence? The cost of helmets in Melbourne

While working on another research paper, I came across a discussion regarding bicycle helmet legislation that I read around the middle of last year. It originated with an article arguing against bicycle helmet legislation[1] and was followed by two responses[2,3]. This was then followed by a reply from the original authors[4].

I will not regurgitate the arguments here, but I I believe the Biegler and Johnson response is outstanding and I highly recommend it be read by anyone with an interest in this topic. One issue I found curious was the advertised cost of a helmet. Biegler and Johnson state

Helmets retail for as low as A$5 while treatment for brain injury can run into millions.

A citation was given which directed the reader to a page on the Melbourne Bike Share website. Information on this page states

Free helmets are now available with our blue bikes.  Just leave the helmet with the bike upon completion of ride.  Easy! Go to our Gallery to view the video as to how to secure the free helmet onto the blue bike. Alternatively, helmets are available for just $5 at many retail outlets or vending machines at Southern Cross Station and Melbourne University. A limit of 2 helmets per customer applies.

A list of stores nearest each Melbourne Bike Share Station follows. If it’s not completely clear bicycle helmets meeting the Australian standard can be purchased for $5, here is a picture.

CheapHelmetsForShareScheme

In a reply to Biegler and Johnson, Hooper and Spicer state

Biegler and Johnson also rely on the claim that the cost of purchasing cycle helmets is fairly marginal. However, quite aside from the fact that most helmets cost far more than the $5 quoted by these authors, it is important to realise that many people are unlikely to skimp when they buy helmets.

No citation or evidence is used to support this statement. I suppose it is possible cyclists could be turned off by a helmet being too inexpensive, but where is the evidence this is actually happening with the Melbourne Bike Share helmets? There’s also no evidence to support the authors claim the “extra cost may well be prohibitive.”

I have a hard time believing a free or $5 helmet is prohibitive to anyone. Also, shouldn’t the lack of supportive evidence presented by Hooper and Spicer have been filtered out during the peer-review process? To paraphrase a famous quote, the presentation of anecdotal arguments against helmet legislation does not constitute a valid argument.

  1. Hooper C, Spicer J. Liberty or death; don’t tread on me. J Med Ethics 2012;38 (6):338–41.
  2. Biegler P, Johnson M. In defence of mandatory bicycle helmet legislation: response to Hooper and Spicer. J Med Ethics.
  3. Trégouët P. Helmets or not? Use science correctly. J Med Ethics.
  4. Hooper C, Spicer J. Bike helmets: a reply to replies. J Med Ethics.