We recently published a letter in the journal Injury Prevention regarding a criticism of our re-analysis of Ian Walker’s bicycle overtaking study. To fit within the journal’s guidelines, we needed to shorten our original draft by a sizeable amount. A lot of important detail was omitted in the process, so I’ve posted the full version below.
Original Response to M Kary
Injury Prevention recently published a commentary critical of epidemiological approaches to cycling safety.[1] The author, M. Kary, suggests that our paper[2], which re-analysed Walker’s[3] study of motor vehicle overtaking distance for cyclists, made false claims about type I errors and confused statistical significance and clinical significance. Kary supports this critique, along with other points in the commentary, with a non-peer reviewed response posted by him to the journal’s website.[4]
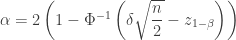
In our paper, we note that increasing power when computing sample size leads to an increase in the probability of a type I error.[2] Kary[1] incorrectly repeats this contention as the probability of a type I error increasing with sample size, suggesting ours was a “false claim”. We will demonstrate that our original assertion regarding type I errors is correct and reinforce the points made in our reanalysis paper regarding statistical versus clinical significance. Both points are important – and often overlooked – issues in quantitative research.
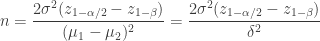
Sample size when comparing two groups on a quantitative variable, such as comparing motor vehicle overtaking distance when wearing or not wearing helmet, is a function of effect size (


Relationship between power and type I error rate for comparing two groups (n=786 and δ=0.2)
As power increases, so does the type I error rate. When power increases to 98%, as in the Walker study, the type I error rate is 0.45. It is true, the type I error rate decreases as sample size increases (while leaving the effect size and power fixed), as suggested by Kary; however, this point is not the claim made in our paper.
It is possible to maintain a nominal type I error while increasing power; however, this comes at a large cost. As in Walker’s study, he chose a small effect size,[5] 
Clinical significance relates to the practical implications of the absolute size of an effect. In the Walker study, Table 1 shows differences (in metres) between helmet wearing and no helmet wearing for various cut points of overtaking distance. For motor vehicles overtaking cyclists at less than 1.5 metres the difference is at most 7 millimetres. The largest absolute effect size is for overtaking at more than 2 metres and amounts to 7.2cm. There is no established appropriate effect size for overtaking distance and neither Walker[3] nor Kary[1] have suggested one. Being overtaken at 2 metres or more seems unlikely to represent a major safety issue, while being overtaken much closer e.g., at 0.75 or 0.753 metres may both be considered risky scenarios. In other words the clinical significance of the helmet effect seems negligible.
| Overtaking distance (m) | Difference(no helmet vs. helmet) | 95% CI |
| (0, 0.75) | -0.052 | -0.224, 0.121 |
| (0.75, 1.00) | 0.003 | -0.061, 0.067 |
| (1.00, 1.50) | 0.007 | -0.012, 0.027 |
| (1.50, 2.00) | 0.017 | -0.003, 0.037 |
| (2.00, ∞) | 0.072 | 0.034, 0.109 |
Table 1. Absolute effect sizes comparing overtaking distance between helmeted and unhelmeted conditions (adapted from Table 8 of Olivier and Walter[2]).
Statistical significance is a function of sample size so it is possible to achieve a statistically significant result that is clinically meaningless when sample size is large.[6] Standarized indices, such as Cohen’s d [7] provide a sample size independent quantification of effect size.
Walker found a statistically significant relationship between helmet wearing and overtaking distance (


As we aimed to demonstrate in our reanalysis of Walker’s data,[2] both the calculated effect size and the absolute effect size do not support helmet wearing as a major factor in overtaking distance between cyclists and motor vehicles. In a follow-up study, Walker and colleagues compared overtaking distances for seven types of cyclists with one type unhelmeted. Even when using a much larger sample size (
Appendix
A formula for computing sample size per group for the two sample t-test is
where 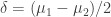


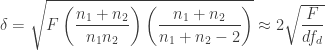
where 
Acknowledgement
This post was co-authored with Scott Walter.
References
- Kary, M. Unsuitability of the epidemiological approach to bicycle transportation injuries and traffic engineering problems. Inj Prev in press.
- Olivier, J, Walter, S. Bicycle Helmet Wearing Is Not Associated with Close Motor Vehicle Passing: A Re-Analysis of Walker, 2007. PLOS ONE 2013;e75424.
- Walker, I. Drivers overtaking bicyclists: Objective data on the effects of riding position, helmet use, vehicle type and apparent gender. Accident Analysis & Prevention 2007;39:417–425.
- Kary M. Fundamental misconceptions of safety and of statistics. Published 1 Dec 2013. PLoS ONE [eLetter] http://www.plosone.org/annotation/listThread.action?root=75587.
- Cohen, J. A power primer. Psychological Bulletin 1992;112:155–159.
- Sullivan, GM, Feinn, R. Using Effect Size—or Why the P Value Is Not Enough. Journal of Graduate Medical Education 2012; 4: 279-282.
- Cohen, J. Statistical power analysis for the behavioral sciences, 1988. Lawrence Erlbaum Associates: Hillsdale, NJ, USA.
- Walker, I, Garrard, I, Jowitt, F. The influence of a bicycle commuter’s appearance on drivers’ overtaking proximities: an on-road test of bicyclist stereotypes, high-visibility clothing and safety aids in the United Kingdom. Accident Analysis and Prevention 2014;64:69-77.
- Thalheimer, W, Cook, S. How to calculate effect sizes from published research articles: A simplified methodology. Available at: http://work-learning.com/

You must be logged in to post a comment.