The Bicycle Network is reviewing their bicycle helmet policy. I’ve been asked by BN CEO Craig Richards to comment on the questions:
Do you believe it should be mandatory to wear a helmet when riding a bicycle? What’s your reasons for your answer?
In the spirit of transparency, what follows is my response to Mr Richards.
Before I respond to this question, I would like to give my impressions regarding the motivations and methods used in this review.
- It is quite reasonable for an organization such as the Bicycle Network (BN) to review their policies and/or advocacy positions. However, why advertise you are reviewing your policies to the media or anyone external to BN? I believe it would be quite rare for any organization to issue a media release and provide interviews to print and television media that they are reviewing their policies.
- What is the population frame for the survey? Whatever it is, it should be informed by what the surveyors are trying to accomplish. If the purpose is to canvas the opinions of the BN, then the survey should have been restricted to BN members. If BN is trying to canvas opinions of Australian cyclists, then this has not been accomplished for the same reason. As far as I am aware, there was nothing in place to ensure responses were BN members or Australian residents or cyclists or even human (i.e., self-report cannot be validated).
- It is well known and accepted that online polls lack scientific rigor. This cannot be changed by statistical analysis or restricting the sample of responders. Given these issues and perhaps the wording of the questions, it is unclear what is actually being measured and whether any of the results will be generalizable to any population. The Statistical Society of Australia has raised similar concerns regarding the Australian Marriage Law Postal Survey.
- These points invalidate the survey results irrespective of whether they are favorable or unfavorable towards bike helmet legislation. In my view, it is an exercise in motivational reasoning and, at a minimum, propaganda to drum up support for a predetermined change in BN policy.
- What is an expert? That is truly a difficult question to answer, but it certainly is not someone who wins a popularity contest. It is also not someone who has an opinion on a topic, including those with doctoral degrees but no formal training or established research record on this topic. It is someone who can evaluate the quality of evidence and not just selectively cite data supportive of their opinions.
- It is well known from multiple surveys here and abroad that lack of cycling infrastructure and concerns for safety are the reasons people do not cycle. So, why have a huge, media-grabbing survey about helmet policy? Why are more important issues not being addressed?
- If BN change their policy, are they prepared to properly evaluate its impact? What if there is no increase in cycling, yet cycling head injuries/fatalities increase? Will the BN accept the potential consequences of that decision?
The reason I support bicycle helmet legislation is because the peer-reviewed research evidence indicates:
- Bicycle helmets are highly effective at mitigating head, serious head (roughly skull fractures and/or intracranial hemorrhage), fatal head, and facial injury,
- Helmet wearing rates are low without helmet legislation and high with them,
- Bicycle helmet legislation is associated with declines in cycling head injury and cycling fatality, and
- There is no strong evidence supportive of common hypotheses presented by anti-helmet and anti-helmet helmet legislation advocates. These include no clear evidence for risk compensation, helmets increasing angular acceleration, helmet legislation deters cycling, helmet legislation is part of the causal pathway for the rise in obesity, or that removing existing helmet legislation will increase cycling or improve population health.
Bicycle helmet legislation is supported by professional societies including the Australasian College of Road Safety, the Australian Injury Prevention Network and the Royal Australasian College of Surgeons.
As an aside, arguments calling for mandatory helmets in cars or for pedestrians are Straw Man arguments. This discussion is about interventions to make cycling safer and not other road users. There are interventions such as lower posted speed limits that benefit all road users, but that is not what is being argued. Additionally, this view implies no measures should be taken to improve cycling safety unless injuries are eliminated for other road users. I find this view to be unethical.
I would also like to add that it is not uncommon for public health interventions to be opposed and debated. This is not unique to bicycle helmets or helmet legislation. However, this discussion should revolve around the available evidence and how “better” evidence may be collected if there are knowledge gaps. Instead, I find bike helmets to be less debate about evidence and more about choosing sides, standing one’s ground and ignoring quality evidence that disagrees with a predetermined position.
There is a misconception Australia is alone in bicycle helmet legislation. My colleagues and I count at least 271 country, state, territory, province or city bicycle helmet laws. That is, there were at 271 instances across the world where legislators proposed legislation, debated its merit, and decided to move forward with legislation.
Countries with bicycle helmet legislation include Argentina, Australia, Austria, parts of Canada, Chile, Croatia, Czech Republic, Estonia, Finland, France, Iceland, Israel, Japan, Jersey, Latvia, Lithuania, Malta, New Zealand, Slovakia, Slovenia, South Africa, South Korea, Spain, Sweden, United Arab Emirates and parts of the United States. These laws differ in terms of enforcement and many apply only to children below a certain age. Ten countries have bicycle helmet laws that apply to all ages (Argentina, Australia, some parts of Canada, Chile, Finland, Malta, New Zealand, South Africa, United Arab Emirates, and parts of the United States). There have only been two jurisdictions that have repealed helmet legislation (Mexico City and Bosnia & Herzegovina) and the impacts of these repeals have never been evaluated. The validity of the argument Australia is alone aside, the reader should be aware that appeals to popularity have no logical foundation.
Below is a list of peer-reviewed articles I have published with colleagues that have informed my position. Many of these papers are available publicly and I am happy to share copies privately. There is also research by others that I would happily point to for any interested reader.
- Grzebieta RH, Olivier J & Boufous S. (2017) Reducing serious injury from road traffic crashes. Medical Journal of Australia, 207(6): 242-243.
- Olivier J & Radun I. (2017) Bicycle helmet effectiveness is not overstated. Traffic Injury Prevention, 18: 755-760.
- Schepers P, Stipdonk H, Methorst R & Olivier J. (2017) Bicycle fatalities: Trends in crashes with and without motor vehicles in The Netherlands. Transportation Research Part F: Traffic Psychology and Behaviour,46: 491-499.
- Olivier J & Creighton P. (2017) Bicycle injuries and helmet use: A systematic review and meta-analysis. International Journal of Epidemiology, 46(1): 278-292.
- Olivier J, Boufous S & Grzebieta R. (2016) No strong evidence bicycle helmet legislation deters cycling. Medical Journal of Australia, 205(2): 54-55.
- Boufous S & Olivier J. (2016) Recent trends in cyclist fatalities in Australia. Injury Prevention, 22(4):284-287.
- Olivier J, Creighton P & Mason CT. (2016) Evidence Bicycle Helmets Mitigate Intracranial Injury is Not Controversial. European Journal of Trauma and Emergency Surgery, 42:333-336.
- Olivier J & Walter SR. (2015) Too much statistical power can lead to false conclusions: A response to Kary (2014). Injury Prevention, 21: 289.
- Olivier J, Wang JJJ, Walter S & Grzebieta R. (2014) Anti-Helmet Arguments: Lies, damned lies and flawed statistics. Journal of the Australasian College of Road Safety, 25(4): 10-23.
- Olivier J, Wang JJJ & Grzebieta R. (2014) A systematic review of methods used to assess mandatory bicycle helmet legislation in New Zealand. Journal of the Australasian College of Road Safety, 25(4): 24-31.
- Olivier J. (2014) The apparent ineffectiveness of bicycle helmets: A case of selective citation (letter). Gaceta Sanitaria, 28: 254-255.
- Wang J, Olivier J & Grzebieta R. (2014) Response to ‘Evaluation of New Zealand’s bicycle helmet law’ (letter). New Zealand Medical Journal, 127(1389): 106-108.
- Olivier J & Walter SR. (2013) Bicycle helmet wearing is not associated with close overtaking: A reanalysis of Walker (2007). PLOS ONE, 8(9): e75424. Erratum in: PLOS ONE, 9(1).
- Bambach MR, Mitchell RJ, Grzebieta RH & Olivier J. (2013) The effectiveness of helmets in bicycle collisions with motor vehicles: A case-control study. Accident Analysis and Prevention, 53: 78-88.
- Walter SR, Olivier J, Churches T & Grzebieta R. (2013) The impact of compulsory cycle helmet legislation on cyclist head injuries in New South Wales, Australia: A response. Accident Analysis and Prevention, 52: 204-209.
- Olivier J, Walter SR & Grzebieta RH. (2013) Long term bicycle related head injury trends for New South Wales, Australia following mandatory helmet legislation. Accident Analysis and Prevention, 50: 1128-1134.
- Olivier J, Churches T, Walter S, McIntosh A & Grzebieta R. (2012) Response to Rissel and Wen, The possible effect on frequency of cycling if mandatory bicycle helmet legislation was repealed in Sydney, Australia: a cross sectional survey (letter). Health Promotion Journal of Australia, 23(1): 76.
- Poulos RG, Chong SSS, Olivier J & Jalaludin B. (2012) Geospatial analyses to prioritize public health interventions: a case study of pedestrian and pedal cycle injuries in New South Wales, Australia. International Journal of Public Health, 57(3): 467-475.
- Walter SR, Olivier J, Churches T & Grzebieta R. (2011) The impact of compulsory cycle helmet legislation on cyclist head injuries in New South Wales, Australia. Accident Analysis and Prevention, 43(6): 2064-2071.
- Esmaeilikia M, Grzebieta R & Olivier J. (2017) A systematic review on the effects of bicycle helmet legislation on cycling. Proceedings of the 6th Annual International Cycling Safety Conference (extended abstract).
- Olivier J & Terlich F. (2016) The use of propensity score stratification and synthetic data to address allocation bias when assessing bicycle helmet effectiveness. 2016 IRCOBI Conference Proceedings – International Research Council on the Biomechanics of Injury, IRC-16-29: 185-193.
- Olivier J, Grzebieta R, Wang JJJ & Walter, S. (2013) Statistical Errors in Anti-Helmet Arguments. Proceedings of the Australasian College of Road Safety Conference.
- Wang JJJ, Grzebieta R, Walter S & Olivier J. (2013) An evaluation of the methods used to assess the effectiveness of mandatory bicycle helmet legislation in New Zealand. Proceedings of the Australasian College of Road Safety Conference.
- Olivier J, Wang JJJ, Walter S & Grzebieta R. (2013) On the use of empirical Bayes for comparative interrupted time series with an application to mandatory helmet legislation. Proceedings of the Australasian Road Safety, Research, Policing and Education Conference.
- Wang JJJ, Walter S, Grzebieta R & Olivier J. (2013) A Comparison of Statistical Methods in Interrupted Time Series Analysis to Estimate an Intervention Effect. Proceedings of the Australasian Road Safety, Research, Policing and Education Conference.


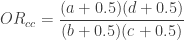
 table gives a continuity corrected odds ratio of
  . In other words, there is an associated 81% reduction in the odds of alcohol involvement among helmet wearers versus those not wearing a helmet in this data set. That is not a trivial result and, perhaps, this is the type of situation the journal is trying to avoid. That is something I fully support.
 and
and 


 and
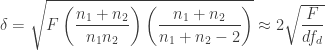
and  is
is
 is the quantile of a normal distribution corresponding to confidence level
  and
and  ,
,  and
and  are the sample mean, sample variance and sample size respectively for group
  .
. , i.e.,
 , and equal sample sizes, i.e.,
  . The equation simplifies to
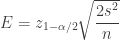
 to get
 unit margin of error and standard deviation
  is
is
 per group. It is common to choose 95% confidence (i.e.,
  ) whereas the margin of error and standard deviation are context specific. One strategy for the margin of error is to choose the smallest value that represents a meaningful difference, so that any smaller value would be considered inconsequential. The choice of standard deviation can be informed by previous research.
 ), the type I error rate (
 ), and power (
 ). For example, using a formula for a two sample t-test (see appendix) the sample size to detect a small effect size[5]
  with 80% power and
  is
is  (or
(or  per group). Leaving power and sample size fixed in this example, Figure 1 shows the type I error rate as a function of power.
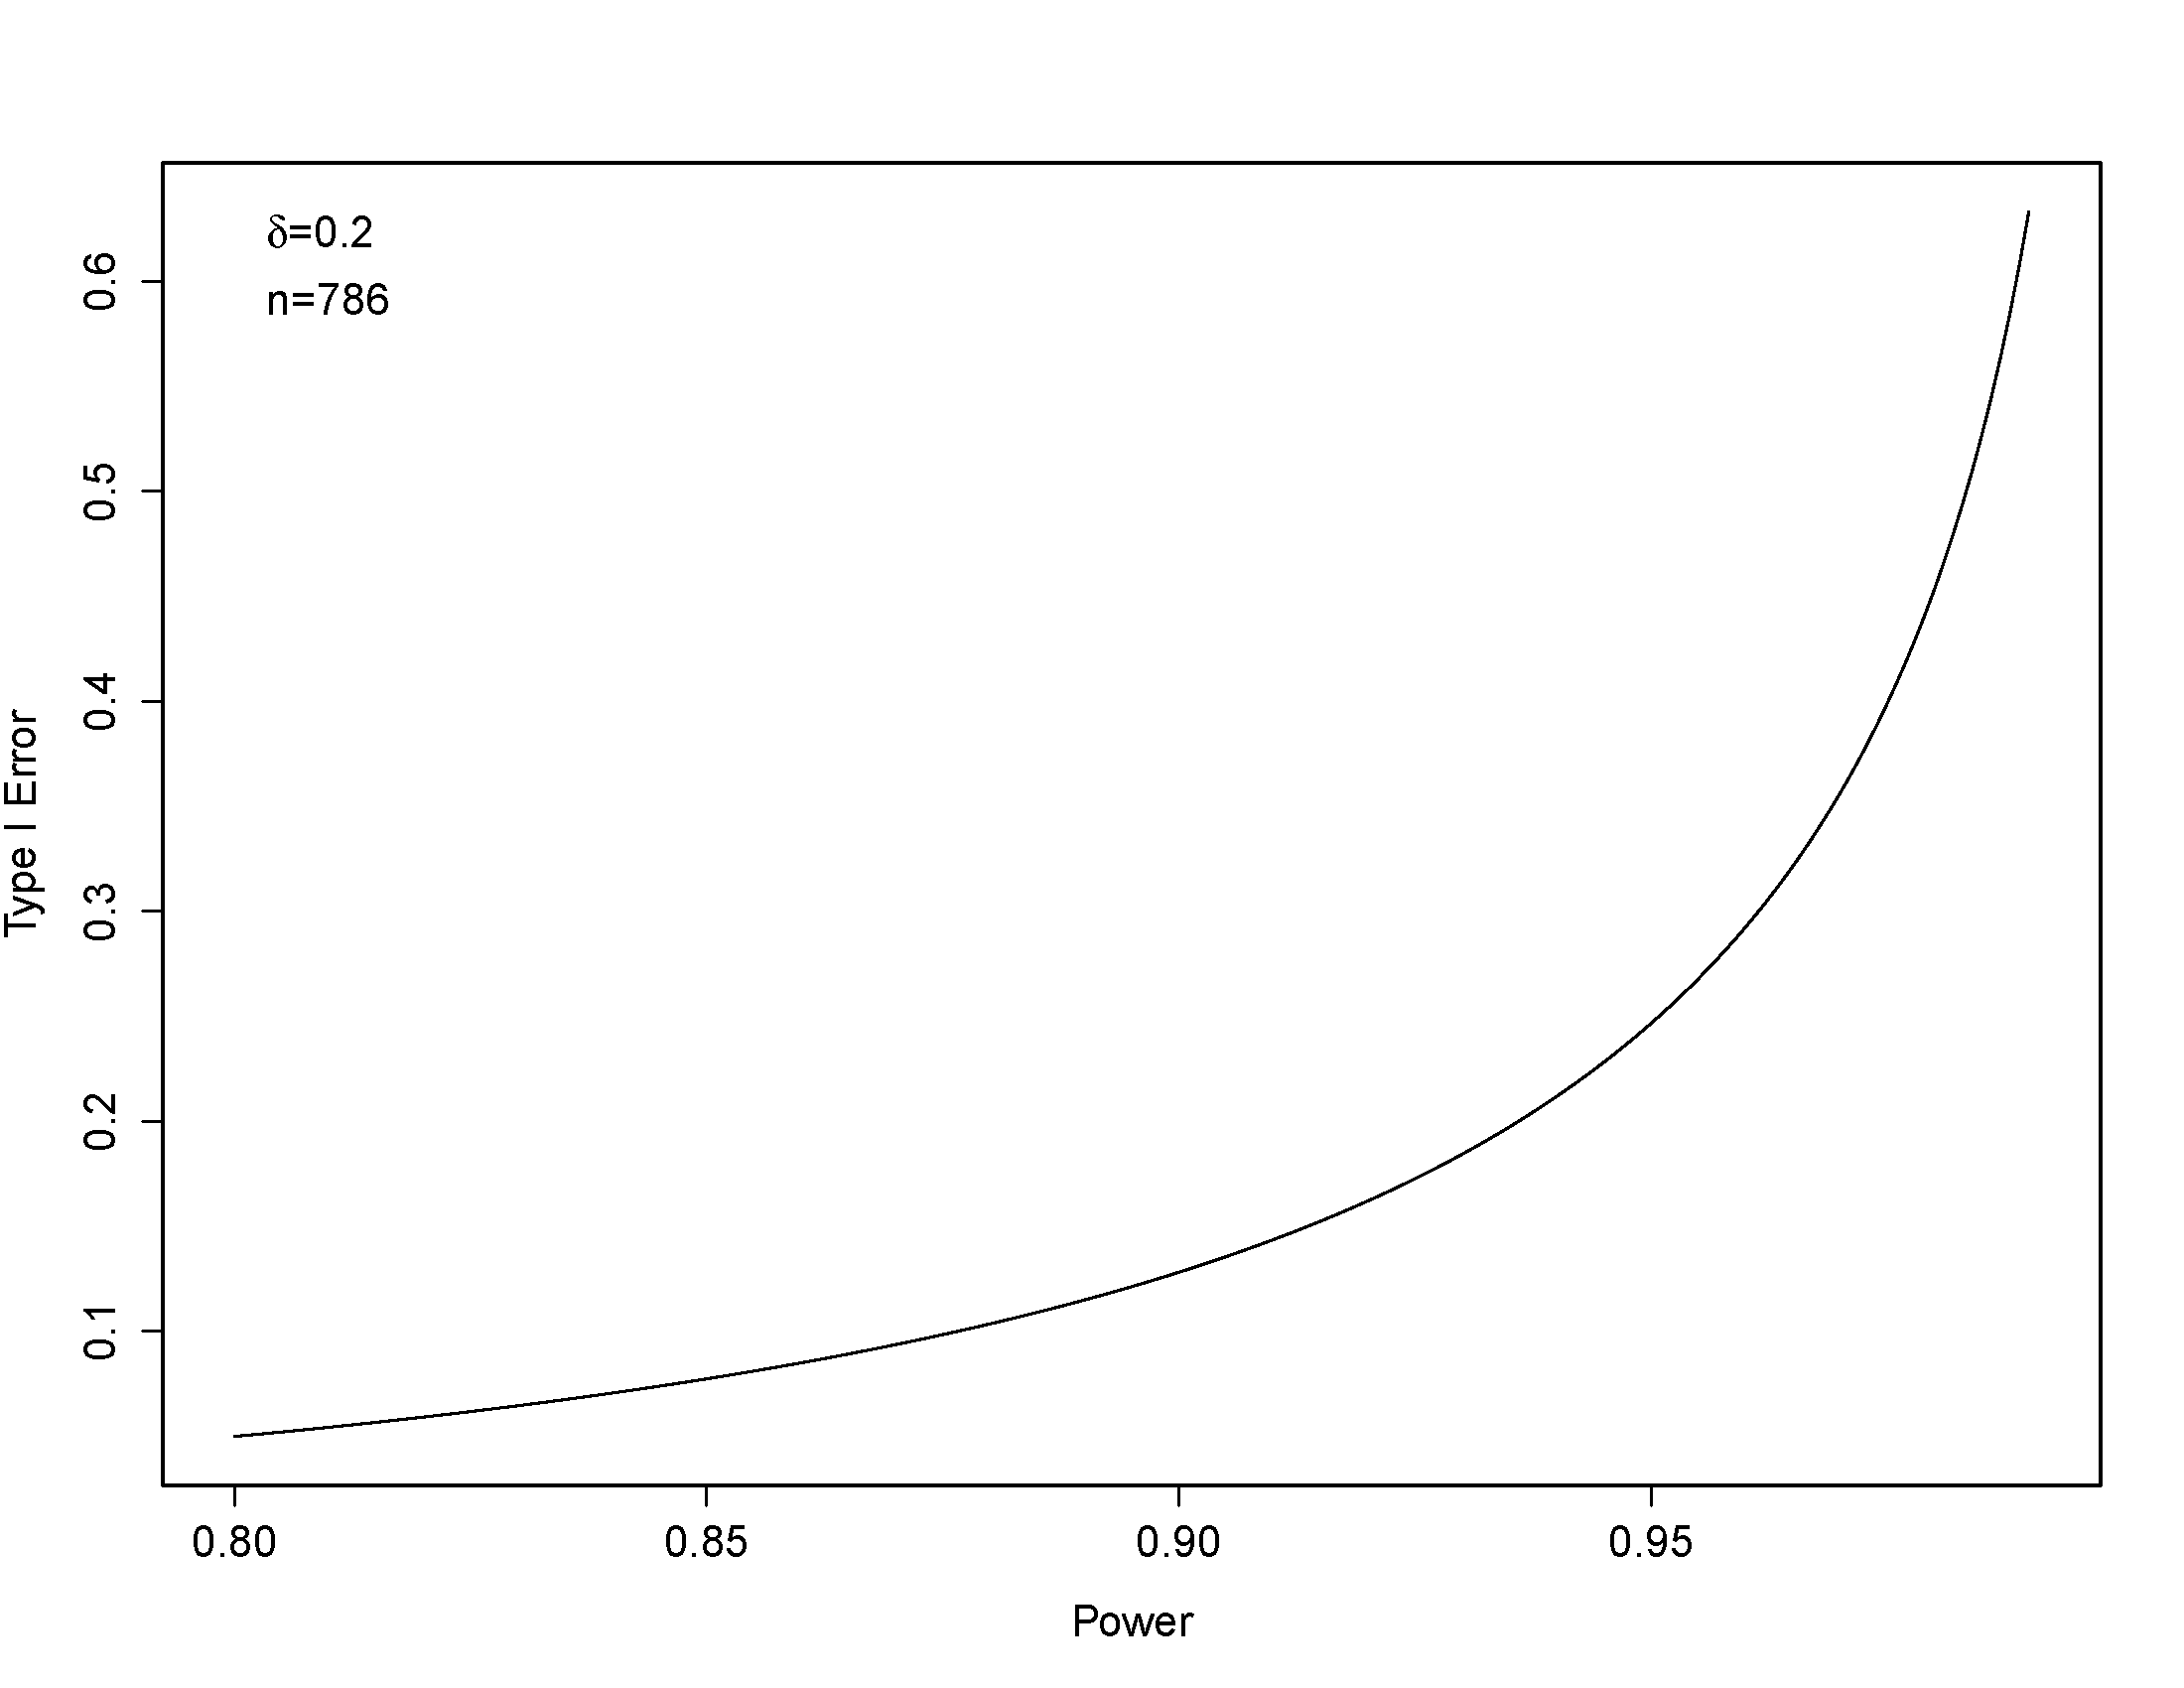
 . However, when a more conventional 80% power is used, the sample size is
  ). This result comes from an ANOVA model with helmet wearing, overtaking distance and their interaction. When the F-statistic is converted to effect size
  which is trivial by Cohen’s definition. Additionally, Walker’s sample size was
  which results in power of 99.8% to detect a small effect size for overtaking distance by helmet wearing status (assuming
  ), no statistically significant helmet effect was observed.[8]
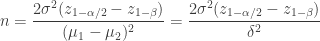
 is the effect size and
  is the
  quantile of the standard normal distribution. In terms of the type I error rate, this equation is
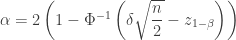
 is the cumulative standard normal distribution. An F statistic for a binary variable can be converted to