More Misinformation from Freestylecyclists.org

I recently came across another excellent cycling article from Alan Davies at The Urbanist. In the article, Davies discusses claims that cycling accidents are on the rise. This is due to an increase in the cycling road toll in 2013. This may be a concern, but it’s impossible to establish a trend from one data point.

Davies briefly mentions helmet legislation, but notes it isn’t relevant to the current discussion (and I agree). However, in the comments, I found a few troubling responses regarding that topic. Strewth states

But we also know from analysis done in the 1990s that among cyclists, the decline in non-head injuries over this period was as great or greater than the decline in head injuries.

No citation or link is given to support this claim. This comment is strange since a previous study of mine estimates a 35% drop in cycling head injury hospitalizations with the NSW helmet law while arm and leg injuries dropped by only 11% and 6% respectively. A more comprehensive response was left by Linda Ward.

Another comment by Nik Dow states

A fact-based explanation is linked (see “detailed explanation”) http://www.freestylecyclists.org/do-helmet-laws-make-much-difference/ and covers the introduction of demerit points and ramping up of speed and red-light cameras.

The link takes you to Freestylecyclists.org, an anti-helmet organization I’ve discussed previously. My previous post pointed to misinformation presented by national spokesperson Alan Todd and the given link is more of the same.

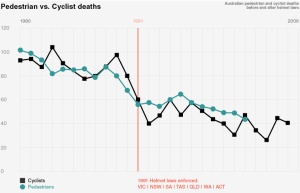
The following plot of cycling and pedestrian fatalities from 1980-2006 in Australia is given and the anonymous author concludes declines in cycling deaths were mostly “due to massive ramping up of speed and red-light cameras, together with the introduction of demerit points.” I’ve assumed this is due to the pedestrian and cycling time series being placed on top of each other.

FSC-Chart-Post-Re-BuildsFA_Pedestrians

What is problematic here is this is not an accurate representation of the fatality data (much of it can be found here). The author has apparently rescaled the pedestrian time series to get them to overlay. As I’ve discussed before, this a strategy too often used to mislead actual temporal relationships of data. In the comments, Davies also questions the accuracy of this figure.

Plotting both time series on the same graph is problematic here since pedestrian fatalities have historically dwarfed those for cyclists (in 1989 they were 501 and 98 respectively). One method to address this problem is to index the time series to a starting value. An advantage of this approach is you’re able to plot trends without distorting scales; however, a disadvantage is the actual data is not being presented and each data point is a comparison with some starting value.

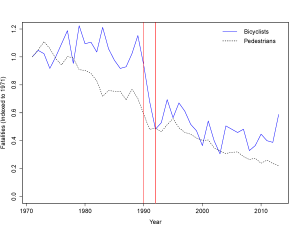
Below is such a plot for the period 1971 to 2013 for cycling and pedestrian fatalities in Australia (the vertical red lines represent the first and last helmet law dates in Australia).

Aust_Cyc_Ped_Fatal

This looks virtually nothing like the Freestylecyclist.org plot. Relative to 1971, pedestrian fatalities have steadily declined over the next 40 years, while cycling fatalities were flat up to the 1990, followed by a substantial decline by 1992 and flat thereafter. This does not suggest declines in cycling fatalities are associated with general road safety improvements such as demerit points or speed cameras. Further, the lack of temporal agreement between cycling and pedestrian fatalities prior to 1990 raises questions regarding pedestrians as a suitable comparator to cyclists.

It is not appropriate to make decisions about trends from eye-balling a figure, so I fit an interrupted time series model to this data. The Poisson model I used was

log(\mu)=\beta_0+\beta_1TIME+\beta_2LAW+\beta_3TIME*LAW

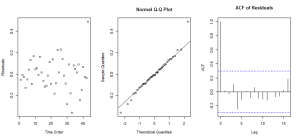
where TIME is centered at 1991 and LAW is an indicator that takes on the value 1 for years 1991 onwards and 0 everywhere else. My results suggest no pre-1990 trend for cycling fatalities (p=0.84) and a 42% decline in cycling fatalities at 1991 (p<0.001). Residual plots indicate good overall fit, although the 2013 observation may exhibit high leverage.0000

Aust_Fatal_Fit_Plots

Something profound happened for cycling fatalities in Australia between 1990-1992. It is often argued helmet legislation deters cycling; however, this is an argument I largely reject due to conflicting evidence from data of low quality.[1] Still, this does not necessarily indicate helmet legislation is a causal factor in lowering cycling fatalities. Yet, this analysis does rule out general road safety interventions as a causal influence proposed by Freedomcyclists.org.

  1. Olivier, J., Grzebieta, R., Wang, J.J.J. & Walter, S. (2013). Statistical Errors in Anti-Helmet Arguments. Australasian College of Road Safety Conference.
New Zealand Cycling Fatalities and Bicycle Helmets

A colleague sent me an assessment of cycling fatalities in New Zealand. The report’s author is Dr Glen Koorey of the University of Canterbury. He’ll be one of the keynote speakers at the upcoming Velo-City Conference in Adelaide. In particular, I was tasked to comment about his section regarding bicycle helmets as they, in part, now form the basis of the Wikipedia page on Bicycle Helmets in New Zealand.

In the report, Koorey states

Only nine victims were noted as not wearing a helmet, similar to current national helmet-wearing rates (92%). This highlights the fact that helmets are generally no protection to the serious forces involved in a major vehicle crash; they are only designed for falls. In fact, in only one case did the Police speculate that a helmet may have saved the victim’s life. There is a suspicion that some people (children in particular) have been “oversold” on the safety of their helmet and have been less cautious in their riding style as a result.

On the surface, he has a point based on independence for probabilities. In mathematical terms, Koorey is stating

P(helmet | fatality) \approx P(helmet)

which is, by definition, independence (if they are equal). So, if the helmet wearing proportion among fatalities is equal to that in population, then helmet wearing is independent of fatality.

As I see it, the problem is in the interpretation as it is not a pure measure of helmet effectiveness. Helmets are a directed safety intervention, so they won’t protect body parts other than the head and you can certainly die from other injuries. It could very well be that helmet wearing is independent of fatalities, but the the sheer force of the collision makes other serious (and possibly fatal) injuries more likely negating any benefit to helmet wearing.

I searched through the publicly available data (found here) and asked around about what’s available in the complete data. In the end, there’s not enough information to identify location or severity of injuries. If we had all the data, a more appropriate probability to investigate would be

P(helmet | \hbox{fatality due to head injury}) = P(helmet)

When looking at the reported data, however, Koorey’s claim the proportion of fatalities wearing a helmet is “similar to current national helmet‐wearing rates (92%)” doesn’t appear justified.

First, he states there were 84 cycling fatalities between 2006-2012 in New Zealand. Of these, about 10% did not have information about helmet wearing. So, there is information on 76 fatalities and 9 of those were not wearing helmets. This gives us the proportion of non-helmet wearers among fatalities of 11.84% (9/76). This is not an estimate since this figure comes from all cycling fatalities in New Zealand.

Koorey wants to compare this to estimates of helmet wearing in New Zealand. Over this time frame, I compute a yearly average helmet wearing rate of 92.57%. So, the proportion of cyclists not wearing helmets is 7.43% during that time. This data could then be summarized by a 2 \times 2 table as

Helmet
Yes No
Death Yes a b
No c d

From the data available, we do know a=67, b=9, \frac{c}{c+d}=0.9257 and \frac{d}{c+d}=0.0743. We would like to compute the risk of death for those wearing helmets versus those that do not; however, this is not possible using this summary data as we don’t really know how many cyclists there are.

Instead, we can compute the odds ratio (OR) which is a good estimate of relative risk for rare events (cycling deaths are certainly rare). The odds ratio is

OR=\dfrac{ad}{bc}=\dfrac{a\frac{d}{c+d}}{b\frac{c}{c+d}}=0.598

If helmet wearing were identical among fatalities and the general population, as Koorey has suggested, the odds ratio would be 1. Instead of being similar, the risk of death is 40% less among helmeted NZ cyclists versus those without a helmet. This figure is consistent with the latest re-re-analysis of a meta-analysis from case-control studies, although this is likely a conservative figure since head (or any other) injuries were not identified.

Statistical significance would be hard to come by here considering we don’t have the exact counts of cyclists from those surveys (or from the general population). However, the asymptotic variance of the log(OR) is

\widehat{var}(log(OR)) \approx 1/a + 1/b + 1/c + 1/d

The last available helmet use survey came from over 4600 cyclists (that is 7*4600 over the study period). Since this is such a sizable number, the last two terms of the variance formula do not contribute much.

Using only the fatalities in the variance formula gives us an asymptotic confidence interval for the odds ratio of

OR\times e^{\pm 1.96 \times s.e.} = (0.298, 1.198)

where the s.e. = \sqrt{1/a + 1/b} (this assumes both 1/c and 1/d are small). Note this result is not statistically significant; however, this is due to having relatively few cycling fatalities (which is good and having less would be better).

There’s also the issue regarding the effect of missing data. One method is to recompute the odds ratio assuming all missings did not wear helmets and repeat assuming all missings did wear helmets giving a range of possible values. The odds ratios are 0.316 and 0.669 respectively. So, at worst, there is an estimated 33% decrease in the risk of death when wearing a helmet versus not.

Koorey’s claims are therefore not justified as the risk of death was much less among helmeted cyclists.This is even without specific information about cause of death and properly assessing helmet effectiveness to lower the risk of a fatality.

I also take issue with Koorey’s statement “This highlights the fact that helmets are generally no protection to the serious forces involved in a major vehicle crash; they are only designed for falls.” A recently published article in Accident Analysis and Prevention states

Considering a realistic bicycle accident scenario documented in the literature (Fahlstedt et al., 2012) where a cyclist was thrown at 20 km/h (i.e. 5.6 m/s which corresponds to a drop height of approximately 1.5 m), our analysis indicates that a helmeted cyclist in this situation would have a 9% chance of sustaining the severe brain and skull injuries noted above whereas an unhelmeted cyclist would have sustained these injuries with 99.9% certainty. In other words, a helmet would have reduced the probability of skull fracture or life threatening brain injury from very likely to highly unlikely.

I also published a paper last year where we found helmets reduced the odds of severe head injury by up to 74% (these were NSW cyclists hospitalised after a motor vehicle crash and reported to the police from 2001-2009). Severe injuries included “Open wound of head with intracranial injury” (S01.83), “Multiple fractures involving skull and facial bones” (S02.7), “Fracture of skull and facial bones, part unspecified” (S02.9), “Loss of consciousness [30 mins-24hrs]” (S06.03), “Loss of consciousness prolonged without return of consciousness ” (S06.05), “Traumatic cerebral oedema” (S06.1), “Diffuse brain injury” (S06.2), “Other diffuse cerebral & cerebellar injury” (S06.28), “Traumatic subdural haemorrhage” (S06.5), “Traumatic subarachnoid haemorrhage” (S06.6), “Other intracranial injuries” (S06.8), and “Intracranial injury, unspecified” (S06.9). None of these are minor injuries.

Using available data, the evidence does suggest helmet wearing mitigates cycling fatalities and serious injury. It does not appear as though the public have been oversold on the benefits of bicycle helmets.

Update: The original version focused on the relative risk of helmet wearing among fatalities and helmet wearing surveys in New Zealand. This made the wording quite strange and difficult to interpret. However, the odds ratio isn’t as problematic and is a good estimate of relative risk of death in this instance.